COVID Data Tracking

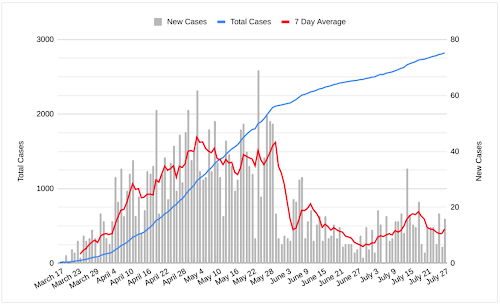
The worldwide COVID-19 pandemic has hit every corner of the world in unprecedented ways. There exist many data reports, analytics tools, and projections about the virus's current and future state. I, however, wanted to create an easily accessible way to track how the virus is spreading in my area, using the number of new cases every day as a guide. Importing Data It turned out the Virginia Department of Health (VDH) used data management software called Socrata to publish and manage data on COVID-19, which conveniently had a continuously updated .csv file hosted on their servers. I copied older data (that wasn't on the hosted .csv file) into a Google Sheets spreadsheet, and used the powerful IMPORTRANGE() function to pull all new data into the sheet. Creating the Graph The data import seemed simple enough, so I then combined the static and imported data. After aggregating it a bit (again using Sheets functions to get the number of new cases, average over 7 days, etc.), the cha...